Pardon me as I take a sip. Ah, the clink of ice cubes in a glass. Yesterday, there was an eclipse. Today marked a change in the seasons. Both involved community, simple pleasures, and an excuse to pause and consider. My frugal choice, a rare martini, and writing this blog post. New seasons are heading our way and it feels good to be prepared.
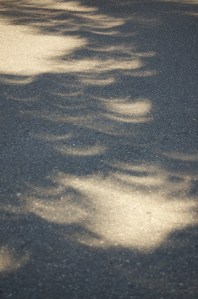
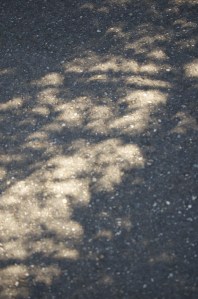
The photos and videos of the eclipse are overwhelming, especially in their quantity. That’s what happens when a rare event happens over a continent filled with smartphones wielded by people who understand science. Very cool. My experience was about an order of magnitude smaller, and yet was memorable. Whidbey Island had 92% of the eclipse (if you could find a place without any fog). That extra 8% made a bigger difference to my camera than to my eyes. I was lucky enough to aim for a place that just happened to be within 200 yards of the fog bank, Greenbank Farm. The Master Gardeners tend an exhibition garden there. Enough other folks with fancier equipment would be focusing on the Sun and the Moon. They were the big show. They were the cause. Causes are interesting. So are effects. Instead of buying special glasses or making a pin hole viewer, I wanted to see what Nature would create. Interlaced leaves create their own versions of pin holes. Instead of getting one image, a plant can create thousands. I wasn’t disappointed. The shrubs created some nice effects, but the grand conifers commandeered the parking lot as a massive canvas for innumerable crescents.
And then, everything returned to normal.
It is August, summer time, and yet time to look ahead. Our trip around the Sun continues and the Autumnal Equinox is about a month away. In the last two months, the area has had less than an inch of rain making Seattle one of the driest cities in the US. This too shall pass. We tend to stay dry for the next month or so, making this my favorite time to go hiking. It also means that the Fall and Winter storms are due. These hot and dry days don’t last long. Soon, the tourists will retreat and the clouds will return. Quiet will get redefined. So will the weather. Now is the time to get ready for wind and rain and cold. Today’s chore, buy and stack firewood that won’t be used for months to prepare for a familiar set of causes (storms) and effects (power outages).
The eclipse didn’t care whether I witnessed it alone. Winter won’t care, either. Both had the benefit of a bit of frugality and community.
Stacking a cord of firewood may be tough enough for those who don’t do it often. Buying it can be even tougher during Summer’s business version of a dry spell. Fortunately, two of my neighbors also wanted firewood and were willing to split a cord three ways, financially. We paid someone else to do the harder version of the splitting. The cord was delivered today by a guy who should have his own reality show. Affable, a ready smile, a forty year old truck that was younger than him, and an attitude of “deal in cash and I’ll get the work done. No worries.”
Cords of wood don’t get delivered in tidy bundles, at least not from anyone I know. Cords also don’t split into exact thirds. Wood is organic, random, and chaotic. We used a simple trick. We sorted the wood into three stacks. Pick up three pieces, put one in each stack. Old adage: Many hands make light work. Put enough randomness in the stacking and things tend to even out. We picked an order for the houses; then, we numbered the stacks 1, 2, 3; called someone up; and had them pick numbers at random. I get the second stack. We split the work, the cost, and the decision making.
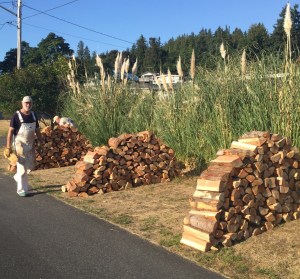
The cause of the activity was preparation for the future. The effect was anticipating nights with a bit more ambiance and maybe some necessary heat.
Despite some scrapes on my forearm and some pine tar that snuck through gaps in my gloves, it feels good to have a supply of firewood in place while the weather is fine and the days are long.
The eclipse could’ve been a solitary event, but being at the farm (really more of an artist and tourist destination than a working farm) meant there were plenty of people about. While I was scurrying around chasing crescents and shadows, dozens were in the parking lot wearing cardboard glasses and looking at the Sun and the Moon dance. A few minutes after the peak, clunk and vroom as people got in their cars to leave. The show wasn’t over. Our Solar System was rewinding a replay, but the folks were done. Some were nice enough to roll down their windows and pass out their glasses. Yay! I got to see the eclipse – and found I was still more interested in the effects than the causes. Some folks may object to handouts, but that’s what literally happened. They handed out something they no longer needed. That’s communal. Something more communal would be to hand out something that’s needed by both the giver and the receiver – but that’s another story.
I’m thinking about changes. (See PretendingNotToPanic.com for “news for those eager and anxious about the future.“) This year has seen more changes than I can recall. Politics certainly aren’t the same, and are definitely changing. Technology is speeding up. Hello electric cars, automation, renewable energy, and medical advances. Climate change is changing the way I expected and feared. The conservative estimates publicized to generate the least controversy are easily being exceeded by the much less encouraging reality of temperatures and oceans rising. The seasons are regular and predictable, even if the weather isn’t. Eclipses aren’t regular, but they are predictable. Both return to some expected version of normal. Politics, technology, and climate don’t have to be regular. They are causes and effects creating expected and unexpected causes and effects.
A friend who also likes to consider such shifts wondered what to do with the resulting possibilities and anxieties. After an eclipse, get back to the regular schedule. After Summer, expect Autumn, Winter, Spring, and another Summer. Those of us who have been considering the less certain changes may find ourselves in a position to help others who are caught by surprise. Unconventional coaches, counselors, and consultants may be the equivalent of eclipse glasses (use as needed) and firewood (resources engaged in preparedness).
After a month of explaining eclipses, orbital mechanics, and photography I know that I enjoy helping people better understand the world and how to live within it.
Considering where we are heading in politics, technology, and the environment, I know that I’d enjoy helping others better understand how to live and work within those possible futures. (Give me a call if you have questions about living and working in our new weird world.)
A few eclipse photos are uploaded. My third of a cord of wood sits by the road waiting for some free afternoon for me to move it. Pine tar is stuck to my fingers, still. My drink is almost gone. The Earth continues to spin around its axis while orbiting the Sun. For a while, it may look like things have returned to normal. Community and frugality have helped. I also know that changes are coming. I’m glad I’m doing what I can to prepare.
I wonder if the alcohol in the martini will help clean off the pine tar. Hmm. Always something new to discover.

Oh no, sweet frog! Don’t stare at the Sun!

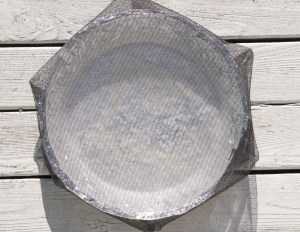
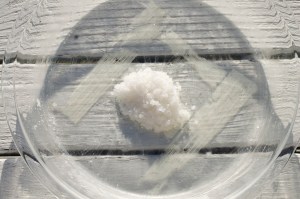


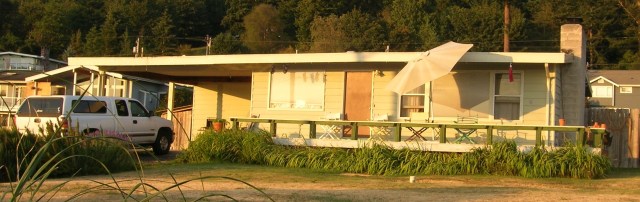
 Not long ago, this twisted, melted piece of plastic was a pulley. A simple, little thing; just a pulley. A simple, little thing broke. In the vast possibilities of bad luck, it broke in one of the best ways, though only after causing a struggle. That was true of my truck. It may be true of other pieces of my life. It’s true for everyone, because every life depends on many simple, little things not failing. This one seems to resonate as a mirror, the other end of an era of troubled times.


 The frugal and resourceful part of me would like to say I’d installed it myself. I tried. Unfortunately, the two dishwashers had completely different electrical and plumbing attachments. Listening to the old dishwasher throw sparks as I pulled it out didn’t help my confidence. Helping at a