
The way we look at data matters, and doesn’t. (Another post that can be generalized, but where it is handy to have an example like MVIS.)
Hopefully this will be one of my shorter posts. It should be because more work went into the data, this time. The plots are simple. The thoughts weren’t.
The default for many stock charts are linear. (Really, almost any chart in the news.) Linear is easiest to understand and easiest to draw; but can miss longer term trends.
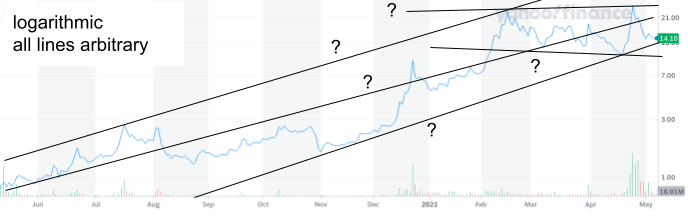
Another popular choice is logarithmic. This one takes some thought because instead of the axis going up like 1, 2, 3 in equal distances on the chart, the steps are 1, 10, 100, etc. Why do such a thing? Because long term trends can be easier to spot.
When a stock is going up the same amount every day, the price grows as a straight line on a linear chart. If the increment stays the same, then the percentage increase gets smaller every day. YAY! turns into Yay! into yay into eh.
When a stock goes up the same percentage every day, the incremental change is small at the start, even possibly so small that it’s lost in the noise. But.
A 1% change when a stock is $0.15 is only $0.0015, not even an penny. But.
A 1% change when a stock is $1.50 is $0.015, barely more than a penny. But.
A 1% change when a stock is $15.00 is up to $0.15. And.
A 1% change when a stock is $150.00 is only $1.50. An increment which has become ten times the total value at the start.
Return on investment is usually expressed as a percentage. On a linear chart for a prolonged period of time, it either takes a magnifying glass to see where things started, or accepting the fact that the curved line rockets through the top of the chart, or a Really Big piece of paper is required. On a logarithmic chart a steady progression is a straight line.
Stocks don’t follow straight lines or curves. The stock market is chaotic, in a mathematical sense. Finding the simple trend within the complicated chaos is an approximation.
Companies don’t follow straight lines or curves. Milestones like earnings reports, press releases, product announcements, are few, even if some of them are regular. The company’s intrinsic value climbs or trips on stairsteps. Internally, there are many tinier steps preceding those stairsteps, but even the managers can’t track every bit of progress. Some of the steps are too small, essential, but too small individually. The stock doesn’t wait. It bounces in the meantime, sometimes driven by rumor or supposition more than official news.
Much of the interest about MicroVision refers back to the recent months. Look at the linear chart and the growth seems to start somewhere in December. Prior to that, barely any progress could be seen (unless you were in the midst of the advance and were very aware that the stock had gone from $0.15 to almost $3.00. $3.00!!?!? Whoo Hoo!)

Look at the logarithmic chart and see a different story. Rather than the last three months looking like the volatile time, they look like a pause in a trend that began back in June 2020. That long term trend looks optimistic. The data and the trends from the last few weeks can look downright dismal, or at least dull when compared to expectations of constant growth. If that earlier trend is the truer story, however, then the short term is temporary. No one knows.
I like charts. I like data. I read discussion boards and tune into various YouTubers because I enjoy understanding others’ methods of interpreting the stocks. And then I make my own assessment.
I am encouraged by recent trends, as I see them.
I am also aware that behind the stock’s machinations, noise, chaos, and investment climate, there’s a company that is striving to make significant, positive, objective progress. Many things are coming together after decades of small, incremental improvements that battled corporate realities. Their cash position dramatically reduced the downside risk. Customers are encouraging, and maybe finally getting past a pandemic’s problems. Possible buyers seem to be progressing (but the price makes me wonder if the stock has overpriced their comfort range). Shorts and such may yet overwhelm any true value of the stock or the company. There are so many unknowns that I doubt any trend line will remain firm for very long because the company and the stock are in the midst of systemic change. Allow me to emphasize that: trends are helpful, but reality has no duty or guarantee to adhere to any trend up or down or sideways or bouncing along.
But.
It is encouraging to see evidence that systemic improvements have a longer history than most realize, and that my dwindled supply of patience might be just enough to enjoy more than just enough of a reward.
Now, about the dangers of extrapolating data…
