
This topic has come up often enough that I guess folks aren’t reading my book (Dream. Invest. Live.)  Actually aside from the sales pitch, there’s a particular aspect of one seemingly simple measure of a company that repeatedly enters conversations; how to make sense of earnings. In particular, what are “good” values of the Price to Earnings ration (P/E, or PE)? It may sound like a dull number, but there is drama in there. And with many folks who like drama, there are times to pay attention to the drama, and times to know it is temporary. There is no one answer, but here’s at least an afternoon’s consideration of PE for small companies.
First, let me make a simple clarification. Earnings are not revenues. A company spends money to make something, they sell it, they get paid, and that’s business. But. It costs money to make something. That term is simple enough, it’s expenses, something we’re all familiar with. The price is effectively the company’s sales and revenues. The difference between the sales and the expenses is the profit (Very Generally – as almost every accountant, bookkeeper, and business owner knows, but hey, this post if for folks who are new to this.) Earnings are effectively profits (again listen to the groans from the professionals, I know, I know.) A company can have great revenues and have even greater expenses. Oops. And yet, that’s the way many companies start. Revenues are positive; but earnings and profits aren’t until the revenues exceed expenses. In an ideal company (which doesn’t exist), expenses happen on the first day, eventually revenues come in after goods or services or sold, hopefully the revenues eventually exceed the expenses and earnings become positive.

Got that? If not, reread or rummage around through the Internet for a different explanation.
So, what’s the company worth? Whatever logic is out there, a company’s worth is like anything else on the market, the value is determined by whatever the market will bear. It would be nice to have some arithmetic to justify buying or selling, so some people value a company by looking at its earnings and comparing it to the price of a share of stock. Simply, if a company cost $1, and it had profits (earnings) of $1 in a year, then buying the company for $1 would make you back your money in one year, and be profit after that. It doesn’t work that way because investors buy shares, very small fractions of a company, but the analogy is why a company with a stock trading at a Price/Earnings of 1.0 is attractive. That’s much better than putting $1 in a savings account at 1% and waiting 72 years to double your money. If PE=1 is attractive, how about PE=2? How about higher? How about a PE of 72? Why would anyone buy a stock that has a PE that reflects nothing more than a savings account? Keep in mind that stocks aren’t insured.
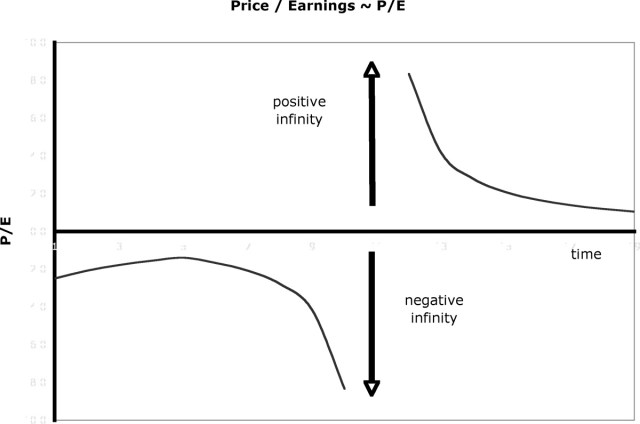
The reason is growth. As earnings grow they can grow faster than expenses, so today’s stock that has a PE=100 would have a PE=50 if the earnings doubled but the stock price stayed the same. A company growing quickly enough can have ridiculously high PEs just as it turns profitable because the earnings are near zero and dividing by zero produces numbers approaching infinity. In that case, how much is too much?
What’s too much is up to each investor. Many investors stick to boring companies with low PEs. The companies aren’t growing quickly, but that may be because they are more stable, less risky. New companies that have great new, unproven ideas frequently also have high expenses to get started, a long time before they make sales, and a longer time before they make a profit. The hope is that when they make a profit, they have high profit margins, phenomenal growth, and become household names. Hello, Apple.
I’m not going to say what’s a good PE or not. But, I found a way to possibly illustrate the realities in the market. The companies with high PEs tend to be small (but not always). Thanks to some web surfing and asking sites the right questions, I was able to create a histogram of PEs for Small Cap companies (market capitalization of less then $2B, for reference, Apple’s market cap is over $580B.)
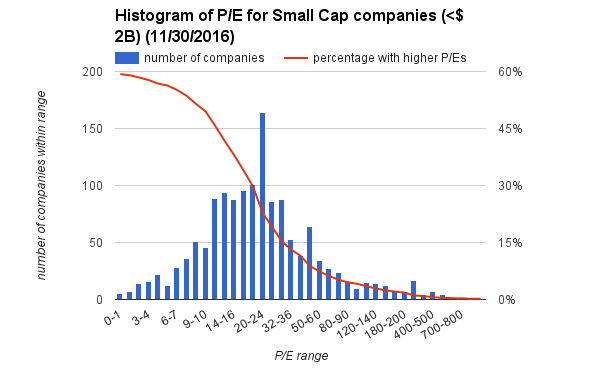
Of the 5,712 stocks I was able to query (thank you automation), 2,364 are small caps. Of the 2,364 small caps, only 1,407 are profitable. That means 41% of small cap companies aren’t making any money. I know too many of them. Only 230 of them have PEs less than 10. The greatest clustering of them is between PE of 12 and 50. Simplistically (and I’ll keep emphasizing the lack of rigor here), that means investors are willing to wait 12 to 50 years to make their money back. Of course, it doesn’t work that way which is why they buy. Growth adjusts the PE, if it happens. Other investors may want to buy the stock enough to encourage someone to sell. Get too expensive though, and demand drops off quickly. Fewer than 100 companies have PEs over 100. Very small E or very high growth can make that happen, and growth quickly increases E and decreases PE, so the effect doesn’t last long.
Of all of my stocks, only one (GIG) has a positive PE, and its PE = 224. It is just turning profitable, E is very small, growth is high, so I am not surprised. Analysts are expecting sales growth of over 19% for next year after 45% growth this year. Today’s PE is good for valuing the company and the stock today, not for next year. E will change, and if it is pleasantly positive, then investors will change P, the price of the stock. Supply and demand will determine the balance.
Because earnings and profits can be adjusted by accounting procedures and intangibles, and because that pesky near-zero period confuses the math, I tend to concentrate on Price to Sales. Sales aren’t as prone to accounting techniques, happen earlier in a company’s development, and can be easier to understand. I may devote a similar post to PS some day.
In the meantime, can a company have a PE> 100? Yes, but very few do, and those that do don’t do so for long. And, if it happens to one or more of my stocks, well, that’s fine by me. First GIG, then AMSC?, AST?, MVIS?
